

Summary
- Graphic 2: October average of each pollutant at the same eight reference stations, 2025 and 2026, in µg/m³ (carbon monoxide in mg/m³).
- Graphic 3: How much each pollutant fell, and the source it is most linked to at EPA’s eight reference stations, October 2025 to October 2026.
- Graphic 4: Stubble-burning incidents in Punjab in October, and acres burnt this season up to 28 October, 2025 and 2026.
Lahore’s air was noticeably better this October than last. Looking at the pollutants one by one shows where that improvement came from
Every year around this time, Lahore goes through the same routine. The rice harvest ends, the nights get cooler, and a grey haze settles over the city for weeks. Schools close, flights are delayed and hospitals fill up with people who can’t stop coughing. We have almost come to accept it as a season of its own.
However, this October looked a little different. EPA Punjab’s reference-grade monitors recorded an average AQI of 186 for the month, down from 218 in October 2025, a fall of about 15%. The city also didn’t have a single day with an average AQI above 300. Last October there were four, and the three Octobers before this one all had days like that. From 9 October onwards, the air was cleaner than on the same date last year on 20 of 23 days.
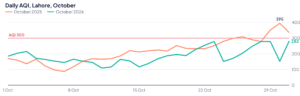
Graphic 1: Lahore’s daily AQI in October 2025 and October 2026. The red line marks AQI 300. Source: EPA Punjab.
That is progress, but it doesn’t mean the air is clean. An AQI of 186 is still unhealthy, and nobody who lives here needs a monitor to tell them so. The more useful question is what changed, and how. The answer lies in which pollutants fell, and by how much.
EPA’s stations measure seven pollutants. PM2.5 is the one that matters most for health, because the particles are fine enough to settle deep in the lungs. In Lahore it comes from crop burning, brick kilns, factories and vehicle exhaust. PM10 is made up of coarser particles, and EPA’s monitoring puts around 60% of it down to dust.
I compared the eight stations that were running in both years, and all seven pollutants were lower this October. PM2.5 fell 19%, from 149 to 121 µg/m³. PM10 was down 11%, nitrogen dioxide 17%, carbon monoxide 30% and sulphur dioxide 40%. AQI dropped at every one of the eight stations, most of all at FMDRC (17%), Kahna Nau (16%) and PU (13%).
Graphic 2: October average of each pollutant at the same eight reference stations, 2025 and 2026, in µg/m³ (carbon monoxide in mg/m³). Source: EPA Punjab.
The weather helped. An independent analysis found that the layer of air that traps smoke over the city at night was deeper this October than last, which gave pollution more room to spread out. But the weather can’t take all the credit. It doesn’t decide how many farmers set their fields on fire, or what fuel a brick kiln burns.

Graphic 3: How much each pollutant fell, and the source it is most linked to at EPA’s eight reference stations, October 2025 to October 2026. Source: EPA Punjab.
Burning rice stubble puts a lot of PM2.5 into the air, and every autumn the smoke drifts over Lahore and the towns around it, pushing AQI up on the worst days. This year there was less of it. Field teams across Punjab reported 339 stubble-burning incidents in October, against 429 a year earlier, a drop of 21%. By 28 October, 260 acres had been burnt this season, compared with 409 by the same date last year. Independent satellite data shows the same trend, with about a third fewer fires spotted in Pakistani Punjab this October.
Much of the groundwork was laid before the harvest. Farmers were served more than 500,000 notices, and awareness campaigns ran across the province. Over 10,000 super seeders were made available, so farmers could sow wheat straight into the rice stubble without burning it first. Where fields were burnt anyway, 48 FIRs have been lodged this season and fines of Rs2.02 million imposed.

Graphic 4: Stubble-burning incidents in Punjab in October, and acres burnt this season up to 28 October, 2025 and 2026. Source: EPA Punjab.
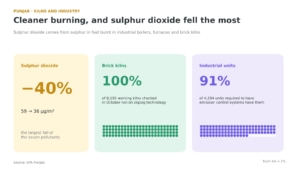
Sulphur dioxide fell the most, by 40%, from 59 to 36 µg/m³. It comes from sulphur in the fuel burnt in industrial boilers, furnaces and brick kilns. All 8,195 working brick kilns inspected in October were on zigzag technology, which burns fuel more completely and gives off less smoke. Of the 4,294 industrial units required to have emission control systems, 91% have now installed them. Tyre pyrolysis plants and the use of carbon powder as fuel, both sources of sulphur dioxide, have also been banned.

Graphic 5: Sulphur dioxide, brick kilns on zigzag technology, and industrial units with emission control systems in Punjab. Source: EPA Punjab.
Factories were being watched closely as well. In October alone, EPA teams carried out more than 17,000 inspections of factories and brick kilns across Punjab, using monitoring data to decide where to go first. They sealed 356 polluting units, demolished 239 illegal ones, registered 183 criminal cases and imposed Rs71 million in fines. In Lahore, officials inspected 1,055 units, more than twice the monthly target, sealed 36 and recovered 89% of the fines.
Transport is the biggest piece of the puzzle. The Urban Unit’s emissions inventory puts it at 83% of Lahore’s emissions. The clearest sign of this shows up in carbon monoxide. It comes from fuel that doesn’t burn properly, usually in old or badly maintained vehicles, and this October it was 30% lower, with a drop at every single station. Nitrogen dioxide also comes from engines, but it forms whenever fuel burns at high temperature, in any vehicle, generator or boiler, and it fell by 17%. Carbon monoxide fell almost twice as much, which suggests the gain came mainly from vehicles burning their fuel more cleanly rather than from less traffic. That fits with what has been happening on the roads. More than 600,000 vehicles have now been through government inspection centres in Punjab, and the Punjab Transport Authority has issued 5,335 challans worth Rs21.1 million, 2,771 of them for smoke emissions. There are also around 5,000 electric vehicles and buses running today.
Dust is a harder problem, because it comes from so many places at once, from building sites to busy roads. Construction sites are required to install mist sprinklers, put up green netting, keep building materials and transport vehicles covered, spray water and clean up regularly. Smog guns are sent to the roads where construction, dust and traffic overlap, at the peak times picked out from monitoring data.
None of this means the problem is solved. November and December are usually the worst months, when cold, still nights hold smoke close to the ground for days at a time.
But October does show that going after pollution at its source makes a difference you can measure. Fewer fields were burnt, kilns burnt their fuel more cleanly, factories and vehicles were being checked, and in the same month pollution fell at all eight monitoring stations. The next two months will show whether that progress holds.
We welcome your contributions! Submit your blogs, opinion pieces, press releases, news story pitches, and news features to opinion@minutemirror.com.pk and minutemirrormail@gmail.com